What does your restaurant's data know that you don't?
Every reservation your restaurant takes leaves a trace: who booked, through which channel, how far in advance, how many actually sat down, what the table spent, and whether those guests ever came back. Most reservation systems collect this data. Very few turn it into something an owner can act on.
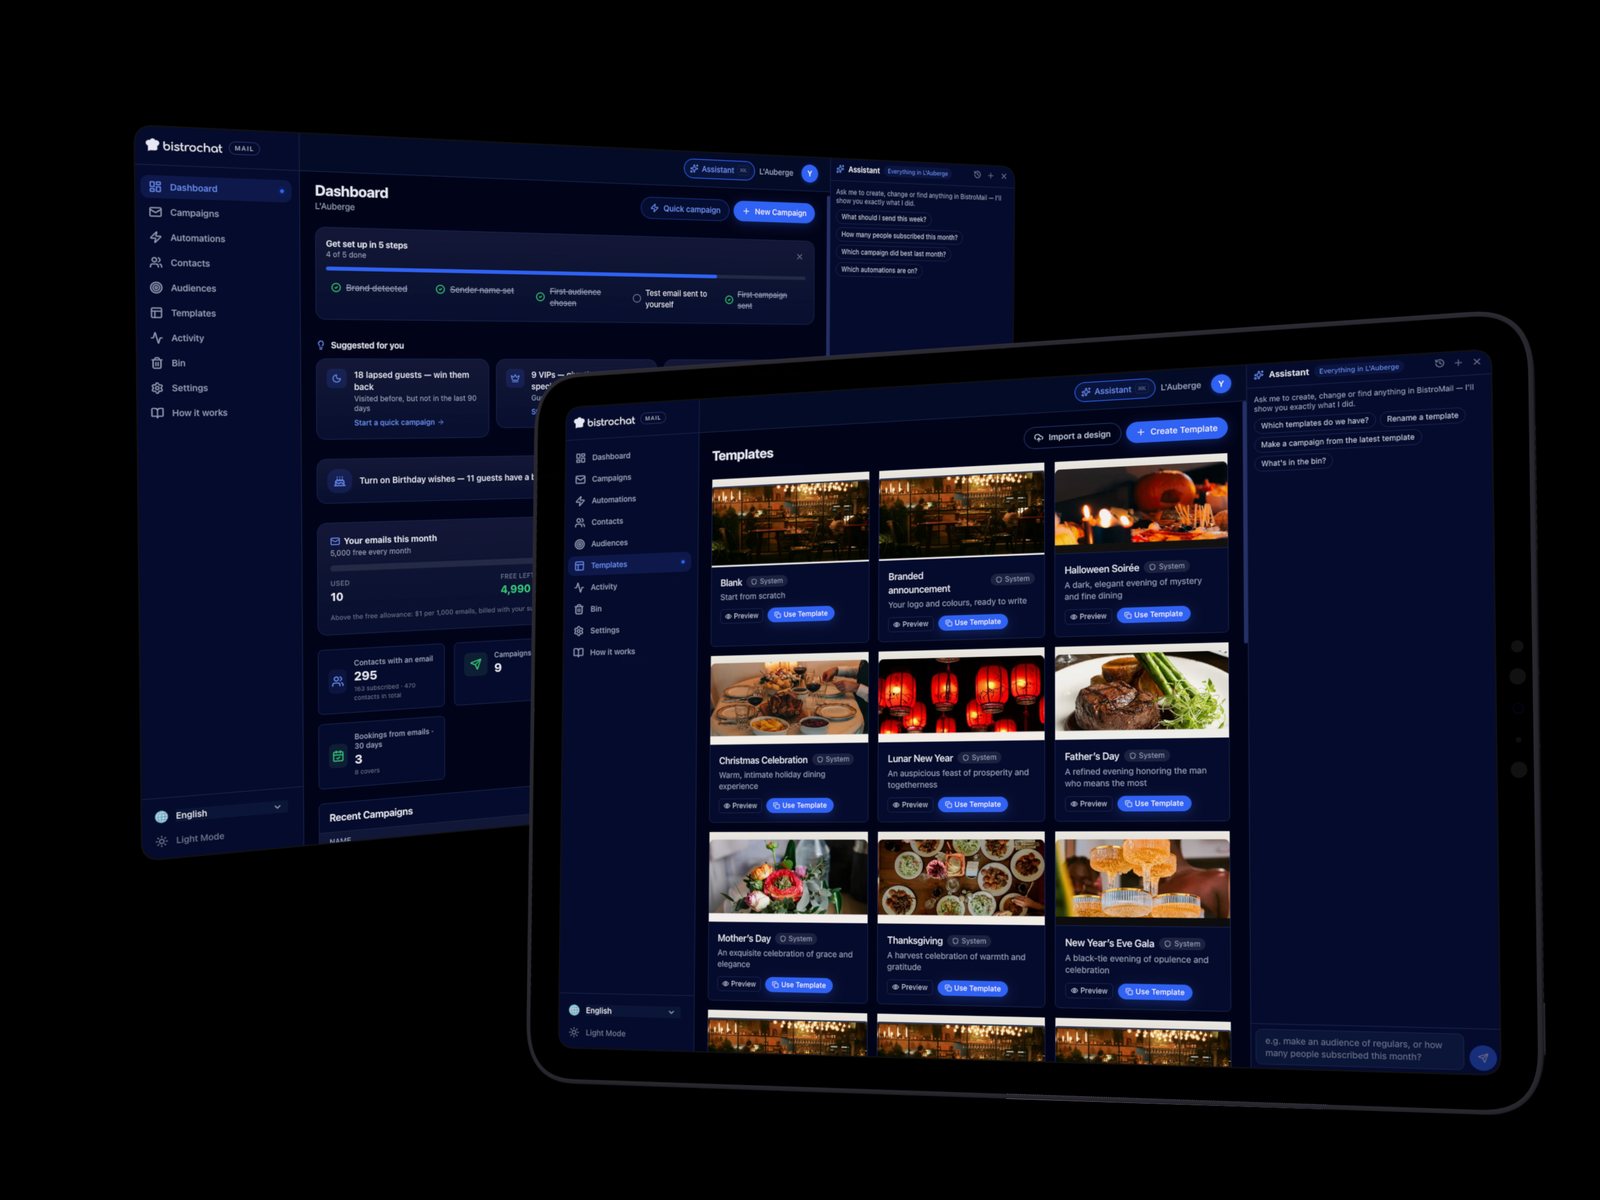
Bistrochat does. Every month, every restaurant on Bistrochat automatically receives a booking intelligence report — a designed, multi-page PDF built from that venue's own live booking and POS data, delivered in English and the restaurant's local language. No setup, no dashboard to learn, no analyst to hire. It arrives in your inbox on the first of the month, and it answers the questions owners actually ask.
This article walks through what's inside — and what it says about the depth of the data layer underneath Bistrochat.
What is restaurant booking intelligence?
Restaurant booking intelligence is the analysis of reservation, guest and point-of-sale data to answer operational questions: how busy was the month really, which booking channels deliver guests who show up, who your most valuable guests are, and what the coming month already looks like. The difference between a booking system and booking intelligence is the difference between storing reservations and learning from them.
Bistrochat's report is built on three connected data sources: the reservation book (every channel, from your website to phone bookings to platforms), guest profiles built across visits, and — for integrated venues — the POS, matched bill by bill to the tables that generated them.
The month at a glance
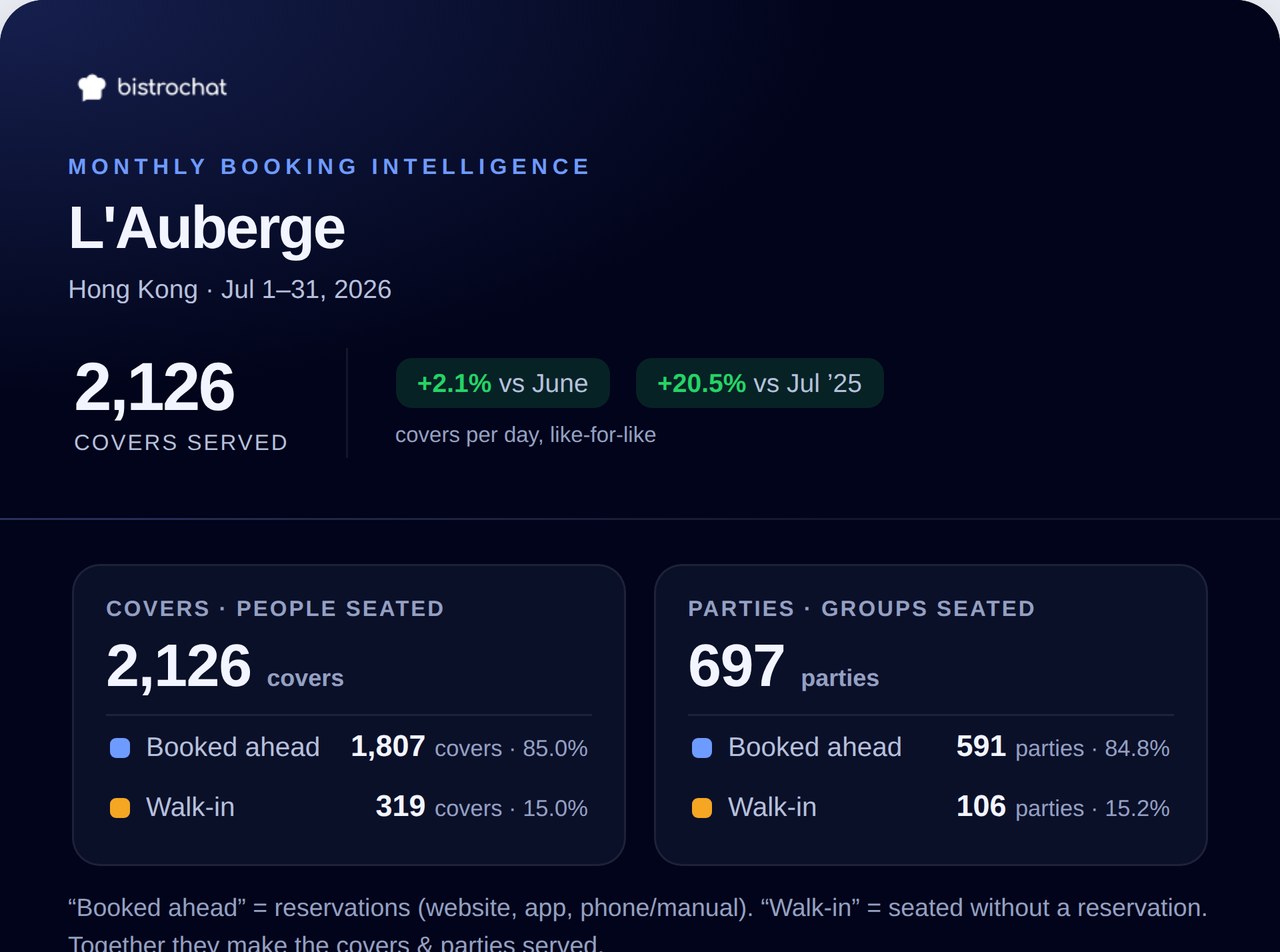
The report opens with the number that matters: covers served — actual people seated, not bookings taken. It splits them into guests who booked ahead versus walk-ins, and puts no-shows and cancellations beside them rather than letting them hide inside the totals.
Every headline number is compared two ways: against last month and against the same month last year. The comparisons are like-for-like — computed per day, so a 31-day month is never flattered by being compared to a 30-day one. Green means up, red means down; nothing needs interpreting.
A daily demand curve then shows which days carried the month and where the quiet spells were — the fastest way to sanity-check staffing against reality.
Where your bookings come from — and what they really cost
The channel mix section shows every source of bookings side by side: your own website widget, Google Reserve, WhatsApp, phone and walk-ins, and third-party platforms. Each channel is labelled honestly — your own versus commission — so you can see at a glance what share of demand you're paying for and what share you own outright. Channels you're connected to that produced nothing are flagged as dormant, with the date they were last active.
Then comes the question almost nobody measures: which channels actually show up? For every platform, the report shows its no-show rate and cancellation rate. Two channels can send you the same number of bookings and behave like different businesses — one filling seats, the other quietly costing you empty tables on a Saturday night. The report also breaks down no-show risk by booking lead time, so you know whether your risk lives in same-day bookings or week-ahead ones — which is exactly the information you need to decide where a deposit or a reconfirmation call earns its keep.
Your guests, ranked by what they're worth
The guest section reads like a maître d's memory, backed by numbers:
- Most frequent diners this month, with their all-time visit counts and how long they've been coming.
- Who brought the most guests — the two-person party that arrived with sixteen friends gets noticed.
- Biggest bills and highest spend per head, for venues with POS integration — computed from real receipts matched to real tables, not estimates.
- New versus returning guests, counted two ways: by reservation and by covers.
- A loyalty curve showing how many guests have visited once, 2–4 times, 5–9 times, and 10+ — your true regulars — plus how many of last year's guests have since returned.
- Celebrations: how many birthdays and anniversaries were booked, because a guest who celebrated once is a guest you can invite back next year.
Guest contact details are masked throughout. The intelligence is in the patterns, not in exposing anyone's phone number.
When your restaurant actually works
Averages hide service patterns; the report pulls them apart. Average covers by day of week show your strongest and weakest nights. A lunch-versus-dinner grid shows the same thing per service — because a quiet Tuesday might be a dead lunch and a perfectly healthy dinner. A booking-time histogram shows when guests arrive across the day, and party-size and lead-time distributions show how big your tables run and how far ahead guests commit, each compared against last month and last year.
This is the section that turns into rotas and promotions: put staff on the rushes, put offers on the proven slow spots.
The money, from your own POS
For venues with an integrated POS, the report adds a full sales layer: total revenue from completed bills, average bill per table, spend per cover, and discounts given. Top-selling categories and best-selling dishes are ranked by revenue with units sold.
Then it connects money back to marketing: spend by booking channel. Every channel is shown with its total revenue, average bill, and — the fair comparison — spend per cover, split by lunch and dinner. A channel that looks small in booking counts can own your dinner revenue; a big-volume channel can be delivering your lowest spenders. Read next to what each channel charges in commission, this is the closest thing the industry has to a profitability statement per booking source.
What guests said — down to the dish
In-app guest reviews are summarised with average scores for food, service and ambience, a month-over-month trend, and a few quotes in guests' own words. Because reviews are matched to each table's bill, the report goes a step further than star ratings: it shows the average food rating of tables that ordered each dish, ranked highest and lowest. Ratings score the whole meal rather than one plate, so it's read as a pattern — but it's an early-warning system most restaurants have never had.
Context: weather, holidays, and typhoons
Numbers move for reasons that have nothing to do with your kitchen. The report closes each month with external context: rainfall and hot days versus the same month last year, public holidays in both windows, and — in the markets where it matters — tropical cyclones that passed nearby. It's presented as context, not cause: a reminder to check what else was going on before reading too much into a year-on-year dip.
Next month, already on the books
The report ends looking forward: confirmed covers and reservations for the coming month, measured against the pace of last month and last year at the same point — so a slow month shows itself while there's still time to act. It lists the regulars already booked and the large parties coming, so the team can plan a warm welcome and prep the big tables before service, not during it.
How it works
There is nothing to configure. Reports generate automatically on the first of every month from each venue's own data, arrive as a covering email with the full report attached as a PDF, and are produced in English plus the restaurant's local language — Bistrochat ships them in more than a dozen languages, from Cantonese and Thai to Polish and Khmer. The data layer underneath is the same one that powers Bistrochat's reservation system across hundreds of restaurants in Asia and Europe: every booking channel in one book, guest profiles that persist across visits, and POS integration that ties revenue back to tables.
Frequently asked questions
What is a good no-show rate for a restaurant? It varies by market and booking mix, but what matters more than the absolute number is where no-shows come from. Bistrochat's report breaks no-show rates down by booking channel and by lead time, so you can target deposits or reconfirmation calls at the specific segment causing the losses instead of adding friction for every guest.
How do I know which booking channel is most profitable? Compare spend per cover by channel, next to each channel's commission. Booking counts alone are misleading: a platform can send many bookings of low-spending guests while your own website sends fewer bookings of higher spenders. Bistrochat computes this automatically from POS bills matched to seated bookings.
Does this require a POS integration? No. Every venue gets the full booking, guest, channel and demand analysis. POS integration adds the money layer: revenue, average bill, spend per cover, dish rankings and spend by channel.
Do I need to build or export anything? No. The report is generated and delivered automatically every month, per venue, in your language. Your data is already doing the work.
How do I get it? Every restaurant on Bistrochat receives it as part of the platform. If you're not on Bistrochat yet, get in touch — the reservation system for every booking channel.